This is page is intended to be a quick instruction on how to analyse data obtained using the SCRT. This HOWTO assumes that you are familiar with how to log on to a linux system. If you are not, or if you are using Windows, please consult the Log-on HOWTO.
Log on to scrt03.astro.su.se with your provided user name and password. If you are unfamiliar with this, please consult the Log-on HOWTO.
The provided analysis software is the Data Reduction Package (DRP), which is written by Michael Olberg. The software is started by going to the directory where the data is stored and typing drp in a terminal, which should throw you to the drp prompt and open a graphics window. This HOWTO will only give the basics of how to measure the kinematics of the milkyway. The DRP package consists of many different tools, which are all described in the DRP manual. An online help is also availible for all tools by giving them the -h flag on the command line.

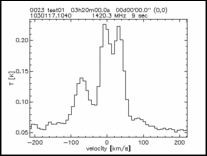
The filenames of your spectra consist of a number and have the suffix fits. For each the observation, there is a signal spectrum and a reference spectrum, that should be subtracted. By giving the command srsub XXs.fits XXr.fits this is done and the result is shown in the DRP window.
The next step is to subtracting the baseline from the spectrum. Choose the velocity ranges where you believe the background continuum is the only contributor to the spectrum. For the example presented here the ranges -200 to -130 and 120 to 220 seem to be appropriate. The command baseline is used to do the fit, using the syntax, baseline -vel -200 -130 -vel 120 220 -order 1. To view the result type showfit, and you should see the fitted line appear in the DRP Window. If you are happy with the fit, type subtract to subtract the baseline, if not, try a different velocity range or a different order to obtain a better fit. After the subtraction type show to see the result.

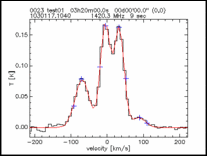
The purpose of this excercise is to measure the velocities, doppler shifts, of the peaks, and to that we wish to fit gaussians to them in order to obtain better values of the positions. The tool gaussline can be used to do this. This is an interactive tool, that first asks you specify how many peaks you think you have, and then let you give a first guess of the position and the full width half maximum (FWHM) of each peak. The gaussians will then be fitted to the spectrum, and the result is given in the terminal window while the actual fit is shown in the DRP window. The velocities can now be used to calculate the distance to observed spiral arms.